January 5, 2017
We’ve been in the Pacific five years now. What should we have done differently before we left on this cruise? What was right on? Here are our three best and worst decisions.
Done Right
Watermaker.
We ended up with a much nicer watermaker than we’d planned to install. It’s a Spectra Cape Horn Extreme and makes up to 14 gallons an hour of fresh water. It has been flawless. Well almost flawless, but that flaw showed one if it’s strengths. One of the two low pressure water pumps went out. No problem. We were able to make seven gallons of water an hour with just one pump running, and we didn’t have to do that for long. The repair of the failed pump in our modular system was quick and easy.
I think this accidental upgrade was very fortuitous considering our diminutive tankage – we hold only 40 gallons of fresh water. We make water almost every day for an hour or so and at only 20 amps of 12 volt DC power, our Solar panels keep up with it just fine.
Solar Panels.
After three years of cruising, we added another solar panel (and new solar controllers). We had two, eighty watt panels on our dodger. With this, we had to run our engine for at least an hour a day to make electricity (we don’t have a generator nor do we want one but that’s another story). I think over half the hours we put on our poor little, overworked engine are from charging.
In Australia two seasons ago, we added a stainless steel bimini and put a big, 327 watt, Sunpower solar panel on top. Now we’re up to 487 watts and since this change, we’ve only run the engine for charging about three hours. What a difference.
It’s not only the increase in solar wattage that’s benefited us, but the Sunpower panel we installed is amazing. It produces significant power in overcast skies or with a low sun angle. It’s much more efficient than our other two panels. The other major improvement was to install Victron Energy solar controllers. We chose to replace our existing, troublesome Blue Sky controller with two of these Victron controllers (for redundancy that has not, thus far, been necessary). Now, our batteries are often at 100% by 10 AM (major drains include our watermaker as well as a refrigerator with a small freezer compartment and heavy use of the computer, TV and electronics).
More…
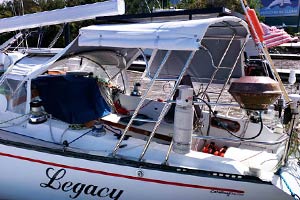
Bimini and Solar Arch
17 Amps from a Cloudy Sky
Refrigeration.
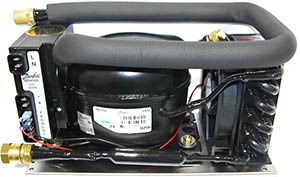
Speaking of our refrigerator, we replaced our ailing holding plate unit that had a massive 1/3 HP motor with a hermetically sealed compressor/evaporator type unit. This has been a major part of our new energy independence as it uses about half the power of our old refrigeration. Our new unit has an extra large condenser and no water cooling. Gone is the water pump noise and significant maintenance required by the water cooling system. I was skeptical about air cooling in the tropics but after two seasons, it’s worked great.
Also, we now have a freezer compartment (inside the evaporator). It’s changed our provisioning for the better. We can stay away from towns longer now that we carry frozen meat and fish. I never knew we needed a freezer until we had one. I never knew we could afford the power demands of a freezer until we had this one.
More…
New Boat Stuff
Other stuff that’s just too good not to mention: I was trying to limit this to the best three things we’d done but I can’t.
Electronics
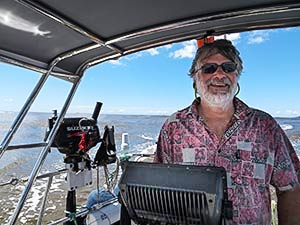
Our electronics have been wonderful. We had a chartplotter in the cockpit for the first time when we left on this cruise. I would never again be without one. All our electronics are integrated and at the touch of a button on our chartplotter, our autopilot will follow a winding path through reef passes. We have a radar unit that uses just an amp of power, is incredibly sensitive and has a reliable guard zone alarm. We run it whenever the boat’s moving and it has made us much safer, and watches much more pleasant.
Diesel Hydronic Heater
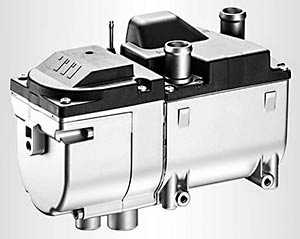
We installed a diesel, Espar (Eberspacher) hydronic heater with a small, plate heat exchanger for hot water heating. Three minutes after we hit the power button, we have all the hot shower water we want (limited, of course by our paltry tankage). It’ll heat the cabin in minutes even on the coldest weather New Zealand’s had to offer. Cyndi made me install this. “Who needs a heater? We’re going to the tropics!” I said before we left Los Angeles. Cyndi said “Just do it” and I did. She was right. It’s great.
More…
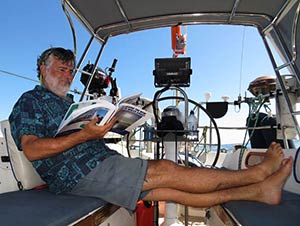
I Took a Shower
Mistakes
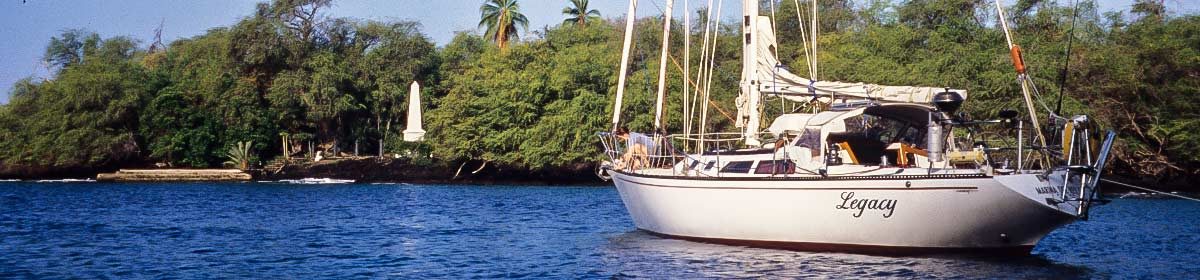
Roller Furling Main. The only time I’ve felt like I might die while cruising on Legacy was when reefing in a storm on the way to Hawaii. I was at the mast and so where the waves, trying to wash me away. I vowed to install roller furling on the main. We did. An in-boom furler. It’s not great.
It’s so hard to get the sail up and down that after a season of using it, we had to install an electric winch in the cockpit. We can’t reef off the wind and have had to turn up into big seas. No fun. In hindsight, I think I would install slab reefing with a stack pack arrangement, making sure the sail could be reefed from the cockpit, even off the wind.
Not Enough Solar (or Shade).
Discussed above, it was a big mistake to leave without sufficient charging capacity. It was also silly to leave without shade over the cockpit. (We had a flimsy bimini that we seldom took the trouble to put up and couldn’t leave up when sailing.) I guess I didn’t realize the tropics would be sunny and hot! Having shade in the cockpit has drastically increased the livable space aboard. Having the additional electricity has… well, you read about it above. -Rich