October 10, 2014
I’m not a meteorologist nor do I claim any special talents in that area.
“Then what business do you have writing about weather here?”
David on Lightspeed showed me a weather trick that has been so valuable I need to share it. Available from Saildocs is a version of GRIB data called a spot fix.
“Yea, yea, I know all about spot fixes, tell me something new!”
“Do you know about the LFTX parameter?”
“Huh?”
“I thought you’d say that.”
I’ll start by explaining the LFTX parameter (LiFTed indeX), then for those that haven’t used them, I’ll go into some detail about spot fixes.
Below is a spot fix request I sent to Saildocs with the LFTX parameter specified:
Spot:18.5S,178.5E|8,3|PRMSL,WIND,WAVES,RAIN,LFTX
And here’s the data that request returned. (Abridged with highlighting added by me – note that all times are in UTC.):
And before I go on, below is the result of the areas highlighted in yellow:
Without getting into a detailed discussion (that I really don’t understand anyway!), lets just say that the more negative the lifted index, the greater the chance of a thunderstorm. If you want the details, there’s an article on Wikipedia here.
Here’s what Wikipedia says about the lifted index (LI) and the chances of a thunderstorm:
- LI is generally scaled as follows:
- LI 6 or Greater, Very Stable Conditions
- LI Between 1 and 6 : Stable Conditions, Thunderstorms Not Likely
- LI Between 0 and -2 : Slightly Unstable, Thunderstorms Possible, With Lifting Mechanism (i.e., cold front, daytime heating, …)
- LI Between -2 and -6 : Unstable, Thunderstorms Likely, Some Severe With Lifting Mechanism
- LI Less Than -6: Very Unstable, Severe Thunderstorms Likely With Lifting Mechanism
I’ve been using this data for almost two years and it’s been of great value in predicting weather that I don’t want experience at sea. There are some times, however, when I’ve seen a big negative lifted index (-5 or so) and there’s been no event. I’ve learned to take the lifted index and rain together.
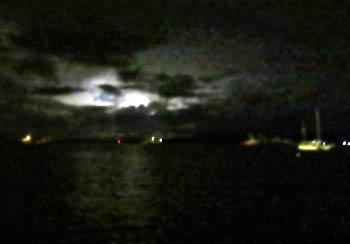
Last night, for example, when we had the big thunderstorm, the lifted index was around -5 and the rain was forecast at around two and a half milimeters per hour. That combination did predict the thunderstorm pictured above. I’ve highlighted those numbers in yellow above.
There were some pretty big negative numbers for LFTX before and after that, but no rain predicted. There was no thunder then. Magic!
I get the lifted index data on a spot fix. I guess there’s a way to get it in a normal GRIB file and configure a GRIB viewer to display the data, but that’s beyond my pay grade.
“What’s all this spot fix crap?”
OK, if that’s you, then here’s your explanation, but even if you’re an old hand at spot fixes, there may be some tricks here you haven’t seen (at least I haven’t seen many others using them).
If you send a request to saildocs like this, you’ll get a wonderful, small text file with your weather data.
Email to: query@saildocs.com
Subject: Saildocs Request (but I don’t think it really matters what you say here)
Message: Spot:18.5S,178.5E|8,3|PRMSL,WIND,WAVES,RAIN,LFTX
It’s the last line, in the email message body, that does the heavy lifting. Here are the details of the request above:
- 18.5S,178.5E – latitude and longitude for the request in decimal minutes
- 8,3 – eight days, every three hours
- PRMSL – surface pressure, or barometer reading
- WIND – surface winds
- WAVES – wave height and direction
- RAIN – rain – duh!
- LFTX – our magical lifted index
(By the way, to get decimal minutes for your grib request, you can use openCPN. Select the wrench icon, then the user interface tab, and then select decimal degrees under “show lat/long as.” Back at the main window, just read off the coordinates from the bottom of the screen when you have your cursor over the position of interest.)
There’s another great trick for requesting gribs. Use Airmail – whether or not you’re actually using the program for email. The Airmail program is used for Sailmail and Winlink email. It’s available here and it’s free. If you’re not going to actually use it for email, I think you can select something like “set up later” when it comes to setting up an account.
This little icon at the top of the screen takes you to the GRIB request window.![]()
From there, you can select either a spot fix or a windowed area for your GRIB request. See the help file for the specifics. When you hit send, the program will create an email in the outbox. I just copy the contents of that message into the email program I’m going to use and I get a perfectly formatted Saildocs request.
Airmail also includes my favorite and very simple GRIB viewer called Viewfax. It’s great for viewing GRIBs you get via email, but also, from the view fax program, you can load GRIB data directly if you have an internet connection – without all that email bother. Just go to the file menu item/get data and off you go. I think you can even do this with a satellite internet connection and it may be faster overall then sending a Saildocs request and picking up the response.
(If the menu ever disappears in Viewfax, just hit the little menu-ish icon in the upper right corner of the screen and it’ll come back.)
You can also get a running spot fix by including a course and speed in your Saildocs request like this…
Spot:18.5S,178.5E|8,3|PRMSL,WIND,WAVES,RAIN,LFTX|5.6,286
Here, at the end of the request, 5.6,286 is 5.6 knots on a course of 286 degrees true. The result will then show you the weather at your projected position as well as the latitude and longitude at the time.
The returned file will start at the time of the request. If you’re planning a departure that’s in the future, you can “fool” Saildocs by projecting your starting position backwards. Simple example: if you’re going to be sailing south at 5 knots and departing in two days, move your starting position north by 240 miles (120 miles a day) and then just ignore the first two days worth of returned data.
I probably don’t need to say that spot fixes are very fast and economical to receive at sea, being simple text files. I guess I just said it.
It’s the power of the Saildocs requests that cause me to be so unhappy with “canned” GRIB providers like WeatherNet, XGate, Global Marine Networks and MailASail. I want to be able to specify the exact data I need and want. I haven’t been able to figure out how to do that with the services above, that is, without just sending an email query to saildocs.
If you’re not familiar with Saildocs, you can find out more on their website here.
I hope you found something helpful here – something that will help you avoid a nasty squall or a thunderstorm, or two. -Rich
Update:

I sent a link to the above to Bob McDavitt so he could tell me if I was saying anything wrong. Bob, if you don’t know of him, is the premier meteorologist in this part of the world. He’s provided weather advice to probably thousands of sailors and helped keep them out of harms way.
I try to learn as much as I can about the weather but in the time I have remaining on this planet, if I studied weather full time, I wouldn’t learn a tenth of what Bob knows. We use him for every major passage and we’ve found his advice to be incredibly accurate. Thank you Bob!
Here’s Bob’s response…
Indeed the lifted index is everything you describe it as, and is a good measure of potential convection— I say potential because once a thunderstorm forms somewhere it makes a moat of sinking air around it and that helps kill those areas around it from having thunderstorms at the same time. then again sometimes the thunderstorms can gang together and form a large area of low pressure and spiral around it—forming tropical cyclones.
The spot value of lifted index then needs to be treated as a potential indicator, NOT a say-so.
Here is a map of Lifted index across Australia and Pacific at present:
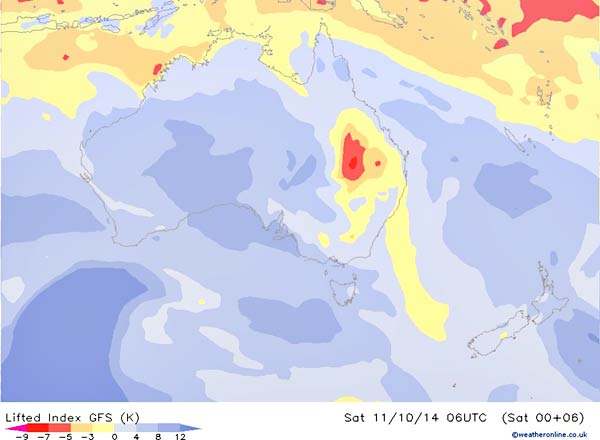
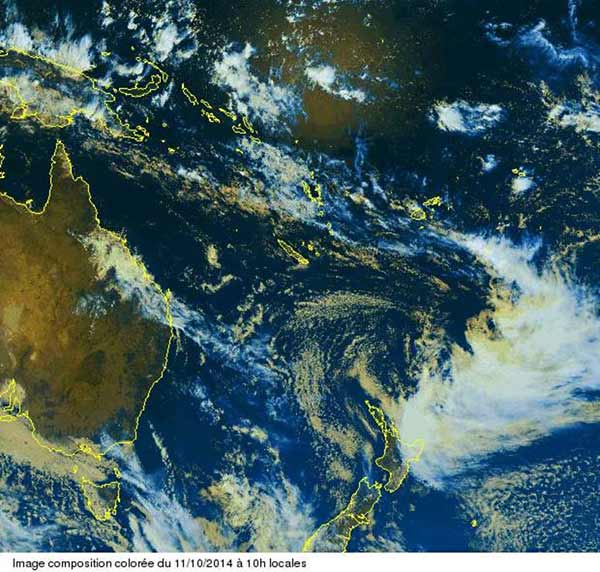
and here is some satellite imagery showing where the showers really are:
There are other indices for convection, but the lifted index , if available is better than CAPE or Showalter index.
If you do NOT have access to any convective index then humble weather measuring instruments such as dew point and bar pressure are useful, if rather broad brush. If your dewpoint is above 21C and air pressure is below 1010 then you can consider yourself at risk of thunderstorms – but they do occur in many other places too.
————-end
Here’s a link to Bob’s website. And here’s a link to his weekly weathergram. We look at it every Monday morning without fail. (If you don’t have interent access, you can get a text version of Bob’s weatergram delivered via Saildocs.)